Fuscous Honeyeater
Ptilotula fusca
ABR description
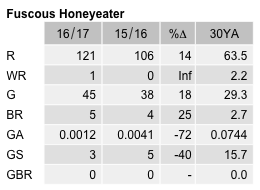
The following is extracted from the Annual Bird Report for the twelve months to June 2017.
Uncommon, breeding resident/ autumn migrant
Uncommon in the suburbs but sometimes overwinters.
General: Number of records slightly higher but reporting rate the same as last year, and less than half the 2.3% 30YA. 41% of records in the winter months, all from lowland locations, but most of these in Jul-Aug and few in the following June, indicating few birds overwintering in 2017. Max 35/9 April near Bredbo GrM28 (LaS1), mean 3.9 and median 2. 5 breeding records, all from southern Namadgi NP; 2 records from Boboyan Rd GrH24 on/1 Jan (SmA1) and dy/13 Feb (DaC2), 2 records from Yankee Hat Gr H25 dy/26 Jan (McD1) and dy/13 Feb (DaC2), and dy/27 Feb Glendale Crossing Gr I23 (LaK1).
GBS: Only 3 records (10 last year, 32 the previous year), the equal lowest number of records (also 2013). 3 sites: 1/4wk Sep Weston GrJ15 (BoJ1), 1/3wk Oct Chapman GrI15 (HoJ1) and 1/16 Apr Giralang GrK12 (McD4). The A value (A=0.0012) was the lowest recorded and 98% down on the 30YA. No breeding records. There has been only 1 breeding record in the 34 years of the GBS, in 2002.
Abundance
Abundance is the average number of birds of that species per survey. Where the species was observed (presence recorded) but the number of birds seen was not recorded, this is treated as a count of zero.
Abundance by year
This chart shows the abundance of Fuscous Honeyeater between 1982 and 2017. 
Abundance by month
This chart shows the monthly abundance of Fuscous Honeyeater. The blue lines show the abundance for the twelve months to June 2017 and the bars show the average abundance for the period 1982 to 2017. 
Abundance by season
This chart shows the seasonal abundance of Fuscous Honeyeater. The blue lines show the seasonal abundance for the twelve months to June 2017 and the bars show the average seasonal abundance for the period 1982 to 2017. 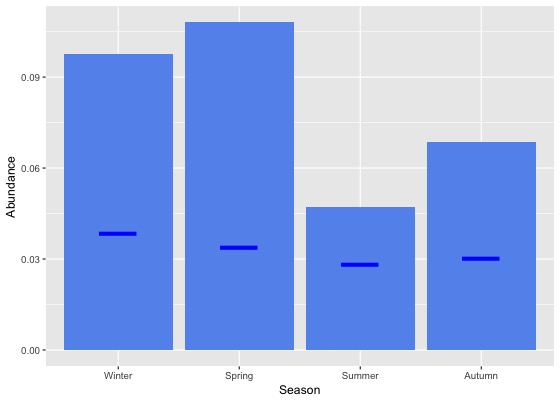
Abundance data
| Month | Season | ||||||||||||||||||
|---|---|---|---|---|---|---|---|---|---|---|---|---|---|---|---|---|---|---|---|
| Period | Jul | Aug | Sep | Oct | Nov | Dec | Jan | Feb | Mar | Apr | May | Jun | Winter | Spring | Summer | Autumn | All | ||
| All years | |||||||||||||||||||
| All | 0.1 | 0.1 | 0.1 | 0.2 | 0.1 | 0.0 | 0.1 | 0.1 | 0.1 | 0.1 | 0.1 | 0.1 | 0.1 | 0.1 | 0.0 | 0.1 | 0.1 | ||
| Previous years | |||||||||||||||||||
| All previous years | 0.2 | 0.1 | 0.1 | 0.2 | 0.1 | 0.0 | 0.1 | 0.1 | 0.1 | 0.1 | 0.1 | 0.1 | 0.1 | 0.1 | 0.1 | 0.1 | 0.1 | ||
| Previous 30 years | 0.2 | 0.1 | 0.1 | 0.2 | 0.1 | 0.0 | 0.1 | 0.1 | 0.1 | 0.1 | 0.1 | 0.1 | 0.1 | 0.1 | 0.1 | 0.1 | 0.1 | ||
| Previous 20 years | 0.2 | 0.1 | 0.1 | 0.2 | 0.0 | 0.0 | 0.1 | 0.1 | 0.1 | 0.1 | 0.1 | 0.1 | 0.1 | 0.1 | 0.0 | 0.1 | 0.1 | ||
| 10 year groups | |||||||||||||||||||
| [2007,2017) | 0.2 | 0.1 | 0.0 | 0.2 | 0.0 | 0.0 | 0.0 | 0.1 | 0.1 | 0.1 | 0.1 | 0.1 | 0.1 | 0.1 | 0.0 | 0.1 | 0.1 | ||
| [1997,2007) | 0.2 | 0.1 | 0.2 | 0.2 | 0.1 | 0.0 | 0.2 | 0.1 | 0.1 | 0.1 | 0.1 | 0.1 | 0.1 | 0.1 | 0.1 | 0.1 | 0.1 | ||
| [1987,1997) | 0.1 | 0.1 | 0.1 | 0.0 | 0.1 | 0.0 | 0.1 | 0.1 | 0.1 | 0.1 | 0.1 | 0.1 | 0.1 | 0.1 | 0.1 | 0.1 | 0.1 | ||
| 5 year groups | |||||||||||||||||||
| [2012,2017) | 0.1 | 0.1 | 0.0 | 0.2 | 0.0 | 0.0 | 0.0 | 0.0 | 0.0 | 0.0 | 0.0 | 0.1 | 0.1 | 0.1 | 0.0 | 0.0 | 0.1 | ||
| [2007,2012) | 0.4 | 0.2 | 0.1 | 0.3 | 0.1 | 0.1 | 0.0 | 0.1 | 0.2 | 0.1 | 0.1 | 0.1 | 0.2 | 0.2 | 0.0 | 0.1 | 0.2 | ||
| [2002,2007) | 0.2 | 0.1 | 0.0 | 0.1 | 0.1 | 0.0 | 0.1 | 0.1 | 0.1 | 0.1 | 0.1 | 0.0 | 0.1 | 0.1 | 0.1 | 0.1 | 0.1 | ||
| [1997,2002) | 0.1 | 0.1 | 0.3 | 0.2 | 0.1 | 0.0 | 0.2 | 0.1 | 0.1 | 0.2 | 0.2 | 0.1 | 0.1 | 0.2 | 0.1 | 0.2 | 0.1 | ||
| [1992,1997) | 0.1 | 0.2 | 0.1 | 0.0 | 0.0 | 0.0 | 0.2 | 0.1 | 0.0 | 0.1 | 0.1 | 0.2 | 0.2 | 0.0 | 0.1 | 0.1 | 0.1 | ||
| [1987,1992) | 0.1 | 0.1 | 0.1 | 0.0 | 0.2 | 0.0 | 0.1 | 0.0 | 0.1 | 0.1 | 0.1 | 0.1 | 0.1 | 0.1 | 0.0 | 0.1 | 0.1 | ||
| Year | |||||||||||||||||||
| 2017 | 0.1 | 0.0 | 0.0 | 0.1 | 0.0 | 0.0 | 0.0 | 0.0 | 0.0 | 0.1 | 0.0 | 0.0 | 0.0 | 0.0 | 0.0 | 0.0 | 0.0 | ||
| 2016 | 0.1 | 0.0 | 0.0 | 0.1 | 0.0 | 0.0 | 0.1 | 0.1 | 0.0 | 0.0 | 0.0 | 0.1 | 0.1 | 0.1 | 0.0 | 0.0 | 0.0 | ||
| 2015 | 0.3 | 0.2 | 0.1 | 0.2 | 0.0 | 0.0 | 0.0 | 0.0 | 0.0 | 0.1 | 0.0 | 0.0 | 0.1 | 0.1 | 0.0 | 0.0 | 0.1 | ||
| 2014 | 0.0 | 0.0 | 0.0 | 0.1 | 0.0 | 0.0 | 0.0 | 0.0 | 0.0 | 0.1 | 0.1 | 0.2 | 0.1 | 0.1 | 0.0 | 0.1 | 0.0 | ||
| 2013 | 0.0 | 0.0 | 0.0 | 0.3 | 0.0 | 0.0 | 0.1 | 0.0 | 0.0 | 0.0 | 0.0 | 0.0 | 0.0 | 0.1 | 0.0 | 0.0 | 0.1 | ||
| 2012 | 0.1 | 0.1 | 0.0 | 0.1 | 0.0 | 0.0 | 0.0 | 0.0 | 0.1 | 0.0 | 0.0 | 0.0 | 0.1 | 0.1 | 0.0 | 0.1 | 0.0 | ||
| 2011 | 0.0 | 0.1 | 0.0 | 0.4 | 0.1 | 0.0 | 0.0 | 0.1 | 0.0 | 0.2 | 0.0 | 0.1 | 0.1 | 0.2 | 0.0 | 0.1 | 0.1 | ||
| 2010 | 0.1 | 0.2 | 0.1 | 0.3 | 0.0 | 0.0 | 0.0 | 0.1 | 0.1 | 0.2 | 0.0 | 0.1 | 0.1 | 0.2 | 0.0 | 0.2 | 0.1 | ||
| 2009 | 1.4 | 0.6 | 0.2 | 0.4 | 0.1 | 0.1 | 0.0 | 0.1 | 0.5 | 0.1 | 0.0 | 0.0 | 0.6 | 0.3 | 0.1 | 0.2 | 0.3 | ||
| 2008 | 0.0 | 0.0 | 0.1 | 0.3 | 0.1 | 0.1 | 0.0 | 0.1 | 0.1 | 0.1 | 0.5 | 0.2 | 0.1 | 0.2 | 0.1 | 0.2 | 0.2 | ||
| 2007 | 0.2 | 0.0 | 0.0 | 0.2 | 0.2 | 0.1 | 0.0 | 0.0 | 0.2 | 0.1 | 0.0 | 0.3 | 0.2 | 0.2 | 0.0 | 0.1 | 0.1 | ||
| 2006 | 0.0 | 0.0 | 0.1 | 0.2 | 0.0 | 0.0 | 0.2 | 0.0 | 0.2 | 0.1 | 0.1 | 0.0 | 0.0 | 0.1 | 0.1 | 0.1 | 0.1 | ||
| 2005 | 0.8 | 0.0 | 0.0 | 0.1 | 0.1 | 0.1 | 0.0 | 0.2 | 0.0 | 0.0 | 0.1 | 0.0 | 0.2 | 0.0 | 0.1 | 0.0 | 0.1 | ||
| 2004 | 0.0 | 0.0 | 0.0 | 0.2 | 0.1 | 0.0 | 0.1 | 0.4 | 0.0 | 0.1 | 0.1 | 0.1 | 0.0 | 0.1 | 0.1 | 0.1 | 0.1 | ||
| 2003 | 0.1 | 0.1 | 0.2 | 0.1 | 0.2 | 0.0 | 0.1 | 0.1 | 0.1 | 0.1 | 0.0 | 0.0 | 0.1 | 0.2 | 0.0 | 0.1 | 0.1 | ||
| 2002 | 0.1 | 0.1 | 0.0 | 0.1 | 0.1 | 0.0 | 0.1 | 0.0 | 0.0 | 0.1 | 0.0 | 0.0 | 0.1 | 0.1 | 0.0 | 0.1 | 0.1 | ||
| 2001 | 0.0 | 0.2 | 0.2 | 0.3 | 0.0 | 0.0 | 0.2 | 0.4 | 0.1 | 0.2 | 0.1 | 0.1 | 0.1 | 0.2 | 0.2 | 0.1 | 0.1 | ||
| 2000 | 0.1 | 0.2 | 0.8 | 0.2 | 0.1 | 0.0 | 0.3 | 0.0 | 0.1 | 0.2 | 0.0 | 0.0 | 0.1 | 0.4 | 0.1 | 0.1 | 0.2 | ||
| 1999 | 1.0 | 0.1 | 0.0 | 0.1 | 0.1 | 0.0 | 0.1 | 0.0 | 0.2 | 0.3 | 0.1 | 0.3 | 0.3 | 0.1 | 0.1 | 0.2 | 0.2 | ||
| 1998 | 0.1 | 0.0 | 0.1 | 0.6 | 0.0 | 0.0 | 0.0 | 0.0 | 0.0 | 0.0 | 1.9 | 0.0 | 0.0 | 0.2 | 0.0 | 0.3 | 0.1 | ||
| 1997 | 0.0 | 0.0 | 0.0 | 0.0 | 0.0 | 0.0 | 0.4 | 0.0 | 0.0 | 0.1 | 0.0 | 0.0 | 0.0 | 0.0 | 0.1 | 0.0 | 0.0 | ||
| 1996 | 0.2 | 0.1 | 0.0 | 0.0 | 0.0 | 0.0 | 0.0 | 0.0 | 0.0 | 0.0 | 0.0 | 0.0 | 0.1 | 0.0 | 0.0 | 0.0 | 0.0 | ||
| 1995 | 0.0 | 0.0 | 0.0 | 0.0 | 0.0 | 0.0 | 0.1 | 0.3 | 0.0 | 0.1 | 0.2 | 0.8 | 0.2 | 0.0 | 0.1 | 0.1 | 0.1 | ||
| 1994 | 0.1 | 0.9 | 0.0 | 0.1 | 0.0 | 0.0 | 0.0 | 0.0 | 0.0 | 0.3 | 0.1 | 0.0 | 0.3 | 0.0 | 0.0 | 0.1 | 0.1 | ||
| 1993 | 0.0 | 0.3 | 0.0 | 0.0 | 0.0 | 0.0 | 1.5 | 0.0 | 0.0 | 0.1 | 0.0 | 0.0 | 0.1 | 0.0 | 0.6 | 0.0 | 0.1 | ||
| 1992 | 0.0 | 0.0 | 0.2 | 0.1 | 0.3 | 0.0 | 0.0 | 0.0 | 0.2 | 0.2 | 0.0 | 0.0 | 0.0 | 0.2 | 0.0 | 0.1 | 0.1 | ||
| 1991 | 0.2 | 0.1 | 0.0 | 0.0 | 1.4 | 0.0 | 0.0 | 0.1 | 0.0 | 0.0 | 0.0 | 0.0 | 0.1 | 0.5 | 0.0 | 0.0 | 0.2 | ||
| 1990 | 0.0 | 0.1 | 0.0 | 0.0 | 0.0 | 0.0 | 0.1 | 0.0 | 0.1 | 0.2 | 0.0 | 0.1 | 0.1 | 0.0 | 0.0 | 0.1 | 0.1 | ||
| 1989 | 0.1 | 0.1 | 0.1 | 0.1 | 0.1 | 0.1 | 0.1 | 0.0 | 0.1 | 0.0 | 0.0 | 0.0 | 0.1 | 0.1 | 0.1 | 0.1 | 0.1 | ||
| 1988 | 0.1 | 0.1 | 0.1 | 0.0 | 0.0 | 0.1 | 0.0 | 0.1 | 0.1 | 0.1 | 0.1 | 0.1 | 0.1 | 0.0 | 0.1 | 0.1 | 0.1 | ||
| 1987 | 0.0 | 0.0 | 0.1 | 0.0 | 0.1 | 0.1 | 0.0 | 0.0 | 0.0 | 0.0 | 0.1 | 0.1 | 0.1 | 0.1 | 0.0 | 0.1 | 0.0 | ||
| 1986 | 0.0 | 0.0 | 0.0 | 0.0 | 0.0 | 0.0 | 0.0 | 0.0 | 0.0 | 0.0 | 0.0 | 0.0 | 0.0 | 0.0 | 0.0 | 0.0 | 0.0 | ||
| 1985 | 0.0 | 0.0 | 0.0 | 0.0 | 0.0 | 0.0 | 0.0 | 0.0 | 0.0 | 0.0 | 0.1 | 0.0 | 0.0 | 0.0 | 0.0 | 0.0 | 0.0 | ||
| 1984 | 0.0 | 0.0 | 0.0 | 0.0 | 0.0 | 0.0 | 0.0 | 0.0 | 0.0 | 0.0 | 0.0 | 0.0 | 0.0 | 0.0 | 0.0 | 0.0 | 0.0 | ||
| 1983 | 0.0 | 0.0 | 0.0 | 0.0 | 0.0 | 0.0 | 0.0 | 0.0 | 0.0 | - | 0.0 | 0.0 | 0.0 | 0.0 | 0.0 | 0.0 | 0.0 | ||
| 1982 | - | 0.0 | - | 0.0 | 0.0 | 0.0 | - | 0.0 | - | 0.0 | - | 0.0 | 0.0 | 0.0 | 0.0 | 0.0 | 0.0 | ||
Reporting rates
Reporting rate is the proportion of all surveys in which the species was present.
Reporting rate by year
This chart shows the reporting rate of Fuscous Honeyeater each year between 1982 and 2017. 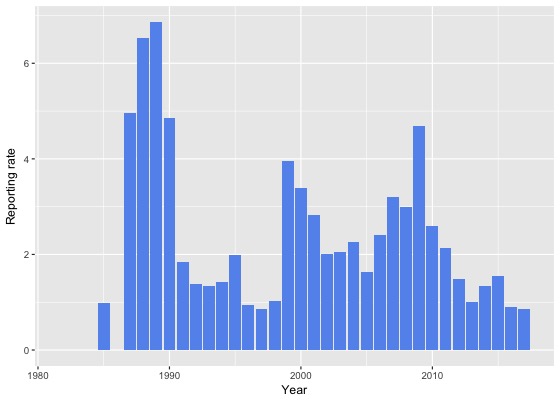
Reporting rate by month
This chart shows the reporting rate by month of Fuscous Honeyeater. The blue lines show the reporting rate for the twelve months to June 2017 and the bars show the average reporting rate for the period 1982 to 2017. 
Reporting rate by season
This chart shows the seasonal reporting rate of Fuscous Honeyeater. The blue lines show the seasonal reporting rate for the twelve months to June 2017 and the bars show the average seasonal reporting rate for the period 1982 to 2017. 
Reporting rate data
| Month | Season | ||||||||||||||||||
|---|---|---|---|---|---|---|---|---|---|---|---|---|---|---|---|---|---|---|---|
| Period | Jul | Aug | Sep | Oct | Nov | Dec | Jan | Feb | Mar | Apr | May | Jun | Winter | Spring | Summer | Autumn | All | ||
| All years | |||||||||||||||||||
| All | 3.6 | 3.3 | 2.1 | 3.2 | 1.3 | 0.8 | 1.3 | 1.2 | 1.3 | 2.5 | 2.2 | 2.6 | 3.1 | 2.4 | 1.1 | 1.9 | 2.1 | ||
| Previous years | |||||||||||||||||||
| All previous years | 3.8 | 3.6 | 2.3 | 3.4 | 1.5 | 1.0 | 1.4 | 1.3 | 1.5 | 2.8 | 2.7 | 2.9 | 3.4 | 2.5 | 1.2 | 2.2 | 2.3 | ||
| Previous 30 years | 3.8 | 3.7 | 2.3 | 3.4 | 1.5 | 1.0 | 1.5 | 1.4 | 1.5 | 2.8 | 2.7 | 3.0 | 3.4 | 2.6 | 1.3 | 2.3 | 2.3 | ||
| Previous 20 years | 3.4 | 3.1 | 1.7 | 3.6 | 0.9 | 0.5 | 1.0 | 1.0 | 1.1 | 2.4 | 2.1 | 2.6 | 3.0 | 2.3 | 0.8 | 1.8 | 1.9 | ||
| 10 year groups | |||||||||||||||||||
| [2007,2017) | 3.4 | 2.6 | 1.3 | 3.7 | 0.7 | 0.6 | 0.6 | 0.7 | 0.8 | 2.0 | 1.6 | 2.7 | 2.9 | 2.3 | 0.6 | 1.4 | 1.7 | ||
| [1997,2007) | 3.4 | 4.0 | 2.6 | 3.2 | 1.4 | 0.4 | 2.4 | 1.8 | 1.7 | 3.5 | 3.5 | 2.5 | 3.2 | 2.4 | 1.4 | 2.7 | 2.4 | ||
| [1987,1997) | 5.3 | 5.5 | 5.4 | 2.8 | 3.5 | 3.5 | 3.9 | 3.1 | 3.7 | 4.7 | 4.6 | 4.6 | 5.1 | 3.8 | 3.5 | 4.4 | 4.2 | ||
| 5 year groups | |||||||||||||||||||
| [2012,2017) | 3.2 | 2.0 | 1.0 | 2.6 | 0.2 | 0.3 | 0.5 | 0.5 | 0.3 | 1.3 | 1.3 | 2.1 | 2.3 | 1.5 | 0.4 | 0.9 | 1.2 | ||
| [2007,2012) | 4.2 | 5.0 | 2.2 | 5.4 | 1.9 | 1.3 | 0.8 | 1.7 | 2.0 | 3.8 | 2.4 | 3.9 | 4.2 | 3.8 | 1.2 | 2.8 | 3.1 | ||
| [2002,2007) | 3.2 | 3.6 | 1.8 | 3.0 | 1.7 | 0.3 | 2.2 | 1.8 | 1.4 | 2.8 | 3.0 | 1.5 | 2.6 | 2.2 | 1.2 | 2.2 | 2.1 | ||
| [1997,2002) | 3.5 | 4.6 | 3.4 | 3.5 | 1.0 | 0.5 | 2.7 | 1.8 | 2.1 | 4.3 | 4.1 | 3.7 | 3.9 | 2.7 | 1.6 | 3.4 | 2.8 | ||
| [1992,1997) | 2.5 | 1.9 | 0.8 | 1.1 | 0.6 | 0.0 | 1.0 | 0.7 | 0.7 | 3.4 | 1.4 | 3.3 | 2.5 | 0.8 | 0.6 | 1.8 | 1.4 | ||
| [1987,1992) | 6.5 | 7.4 | 7.6 | 3.7 | 4.9 | 5.0 | 5.5 | 4.0 | 5.5 | 5.5 | 6.3 | 5.4 | 6.5 | 5.3 | 4.8 | 5.8 | 5.6 | ||
| Year | |||||||||||||||||||
| 2017 | 2.9 | 2.1 | 0.9 | 1.8 | 0.4 | 0.0 | 0.6 | 0.7 | 0.1 | 0.6 | 0.4 | 0.7 | 1.7 | 1.1 | 0.5 | 0.4 | 0.9 | ||
| 2016 | 2.7 | 0.6 | 0.2 | 1.9 | 0.1 | 0.3 | 0.7 | 0.4 | 0.2 | 0.8 | 1.0 | 2.7 | 1.9 | 0.9 | 0.5 | 0.6 | 0.9 | ||
| 2015 | 4.7 | 4.9 | 3.0 | 2.5 | 0.2 | 0.4 | 0.4 | 0.4 | 0.4 | 1.6 | 1.4 | 1.1 | 3.1 | 2.0 | 0.4 | 1.1 | 1.6 | ||
| 2014 | 1.2 | 0.4 | 0.3 | 2.7 | 0.0 | 0.4 | 0.3 | 0.7 | 0.0 | 1.8 | 2.6 | 5.5 | 3.1 | 1.4 | 0.4 | 1.2 | 1.3 | ||
| 2013 | 0.9 | 1.4 | 0.2 | 3.3 | 0.8 | 0.2 | 0.9 | 0.9 | 0.0 | 1.6 | 0.8 | 0.0 | 0.7 | 1.7 | 0.6 | 0.8 | 1.0 | ||
| 2012 | 5.1 | 3.1 | 0.5 | 3.6 | 0.0 | 0.0 | 0.4 | 0.0 | 1.5 | 1.4 | 0.5 | 0.6 | 2.7 | 1.9 | 0.2 | 1.2 | 1.5 | ||
| 2011 | 0.8 | 3.2 | 1.2 | 5.7 | 1.2 | 0.6 | 0.9 | 1.8 | 1.2 | 3.8 | 1.1 | 1.5 | 1.7 | 3.6 | 1.0 | 2.1 | 2.1 | ||
| 2010 | 3.1 | 9.6 | 2.2 | 3.8 | 1.0 | 1.5 | 1.0 | 2.4 | 1.2 | 5.5 | 0.0 | 1.1 | 3.6 | 2.7 | 1.4 | 2.7 | 2.6 | ||
| 2009 | 12.9 | 11.5 | 4.9 | 7.2 | 1.8 | 2.1 | 1.3 | 2.5 | 4.7 | 3.7 | 3.1 | 0.9 | 6.8 | 5.4 | 2.0 | 3.9 | 4.7 | ||
| 2008 | 1.4 | 0.9 | 1.1 | 4.8 | 2.7 | 0.9 | 0.8 | 1.9 | 1.1 | 2.5 | 8.1 | 6.5 | 3.6 | 3.5 | 1.1 | 3.1 | 3.0 | ||
| 2007 | 1.1 | 0.9 | 1.2 | 5.2 | 3.4 | 1.7 | 0.4 | 0.0 | 2.1 | 3.8 | 1.6 | 9.1 | 5.9 | 3.7 | 0.9 | 2.7 | 3.2 | ||
| 2006 | 3.3 | 3.9 | 2.6 | 3.3 | 1.2 | 0.0 | 3.4 | 1.5 | 2.1 | 3.2 | 1.4 | 2.3 | 2.9 | 2.7 | 1.6 | 2.3 | 2.4 | ||
| 2005 | 7.4 | 2.8 | 1.5 | 1.7 | 0.7 | 1.2 | 0.0 | 2.2 | 0.9 | 1.1 | 1.5 | 1.1 | 3.2 | 1.3 | 1.0 | 1.1 | 1.6 | ||
| 2004 | 0.8 | 4.6 | 0.0 | 5.8 | 1.2 | 0.5 | 2.4 | 4.0 | 1.0 | 2.7 | 5.8 | 2.5 | 2.3 | 2.2 | 1.9 | 2.7 | 2.3 | ||
| 2003 | 4.3 | 2.9 | 3.0 | 0.5 | 3.2 | 0.0 | 3.0 | 1.1 | 2.2 | 1.8 | 3.1 | 1.2 | 2.6 | 2.3 | 1.1 | 2.3 | 2.1 | ||
| 2002 | 2.9 | 3.4 | 2.0 | 3.4 | 1.5 | 0.0 | 1.9 | 1.3 | 0.5 | 5.4 | 5.9 | 0.5 | 2.1 | 2.4 | 0.8 | 3.2 | 2.0 | ||
| 2001 | 0.9 | 8.4 | 4.7 | 4.2 | 0.0 | 1.4 | 1.5 | 4.6 | 1.2 | 3.4 | 2.3 | 2.0 | 3.4 | 3.5 | 2.4 | 2.1 | 2.8 | ||
| 2000 | 9.5 | 4.6 | 6.5 | 6.6 | 1.9 | 0.0 | 3.3 | 0.5 | 3.3 | 5.8 | 0.0 | 0.5 | 4.3 | 5.0 | 1.2 | 3.6 | 3.4 | ||
| 1999 | 8.8 | 2.1 | 0.0 | 1.3 | 2.6 | 0.6 | 5.1 | 1.4 | 2.7 | 5.2 | 8.0 | 10.3 | 7.8 | 1.2 | 2.3 | 5.2 | 3.9 | ||
| 1998 | 2.7 | 1.9 | 2.4 | 1.1 | 0.0 | 0.0 | 0.0 | 0.0 | 1.1 | 0.0 | 3.7 | 1.3 | 1.8 | 1.2 | 0.0 | 1.3 | 1.0 | ||
| 1997 | 0.0 | 0.0 | 0.0 | 0.0 | 0.0 | 0.0 | 2.0 | 0.0 | 2.5 | 2.8 | 6.7 | 0.0 | 0.0 | 0.0 | 0.5 | 3.6 | 0.9 | ||
| 1996 | 7.5 | 2.1 | 1.3 | 0.9 | 0.0 | 0.0 | 0.0 | 1.2 | 0.0 | 0.0 | 0.0 | 0.0 | 2.8 | 0.7 | 0.3 | 0.0 | 0.9 | ||
| 1995 | 2.2 | 0.8 | 0.0 | 0.6 | 0.0 | 0.0 | 0.9 | 1.6 | 0.0 | 3.2 | 5.2 | 11.7 | 4.4 | 0.3 | 0.8 | 2.7 | 2.0 | ||
| 1994 | 2.0 | 1.3 | 0.0 | 2.3 | 0.0 | 0.0 | 0.0 | 0.0 | 0.0 | 6.1 | 1.2 | 1.1 | 1.4 | 0.7 | 0.0 | 3.0 | 1.4 | ||
| 1993 | 0.0 | 5.1 | 0.0 | 1.3 | 1.5 | 0.0 | 4.1 | 0.0 | 0.0 | 1.7 | 0.0 | 1.4 | 2.6 | 1.0 | 1.6 | 0.5 | 1.3 | ||
| 1992 | 0.0 | 0.0 | 2.4 | 1.1 | 2.8 | 0.0 | 1.7 | 0.0 | 4.2 | 3.4 | 0.0 | 0.0 | 0.0 | 2.0 | 0.6 | 2.4 | 1.4 | ||
| 1991 | 4.7 | 3.2 | 1.2 | 0.0 | 3.1 | 1.4 | 0.0 | 4.0 | 0.0 | 1.7 | 0.0 | 0.0 | 3.3 | 1.4 | 1.7 | 0.5 | 1.8 | ||
| 1990 | 4.5 | 6.5 | 4.3 | 1.0 | 3.7 | 4.2 | 6.9 | 2.8 | 3.4 | 8.3 | 2.7 | 9.2 | 6.2 | 3.0 | 4.7 | 4.9 | 4.9 | ||
| 1989 | 6.1 | 7.8 | 11.8 | 7.7 | 5.6 | 5.7 | 11.2 | 4.1 | 6.7 | 5.1 | 4.6 | 4.2 | 6.2 | 8.4 | 6.9 | 5.5 | 6.9 | ||
| 1988 | 9.5 | 9.7 | 7.3 | 2.7 | 2.8 | 5.6 | 3.5 | 7.4 | 8.4 | 8.0 | 9.1 | 5.8 | 8.5 | 3.9 | 5.4 | 8.5 | 6.5 | ||
| 1987 | 0.0 | 0.0 | 7.3 | 3.1 | 7.2 | 5.2 | 3.1 | 1.7 | 4.3 | 3.7 | 7.9 | 5.9 | 5.2 | 6.0 | 3.3 | 5.3 | 5.0 | ||
| 1986 | 0.0 | 0.0 | 0.0 | 0.0 | 0.0 | 0.0 | 0.0 | 0.0 | 0.0 | 0.0 | 0.0 | 0.0 | 0.0 | 0.0 | 0.0 | 0.0 | 0.0 | ||
| 1985 | 0.0 | 0.0 | 0.0 | 0.0 | 0.0 | 0.0 | 0.0 | 0.0 | 0.0 | 5.3 | 20.0 | 3.6 | 1.1 | 0.0 | 0.0 | 7.5 | 1.0 | ||
| 1984 | 0.0 | 0.0 | 0.0 | 0.0 | 0.0 | 0.0 | 0.0 | 0.0 | 0.0 | 0.0 | 0.0 | 0.0 | 0.0 | 0.0 | 0.0 | 0.0 | 0.0 | ||
| 1983 | 0.0 | 0.0 | 0.0 | 0.0 | 0.0 | 0.0 | 0.0 | 0.0 | 0.0 | - | 0.0 | 0.0 | 0.0 | 0.0 | 0.0 | 0.0 | 0.0 | ||
| 1982 | - | 0.0 | - | 0.0 | 0.0 | 0.0 | - | 0.0 | - | 0.0 | - | 0.0 | 0.0 | 0.0 | 0.0 | 0.0 | 0.0 | ||
Breeding data
Breeding records by month
Number of breeding records by breeding code and month, 2017 and all years| Breeding code | Jul | Aug | Sep | Oct | Nov | Dec | Jan | Feb | Mar | Apr | May | Jun |
|---|---|---|---|---|---|---|---|---|---|---|---|---|
| 2017 | ||||||||||||
| Breeding (BLA code) | 0 | 0 | 0 | 0 | 0 | 0 | 0 | 0 | 0 | 0 | 0 | 0 |
| Carrying Food | 0 | 0 | 0 | 0 | 0 | 0 | 0 | 0 | 0 | 0 | 0 | 0 |
| Copulating | 0 | 0 | 0 | 0 | 0 | 0 | 0 | 0 | 0 | 0 | 0 | 0 |
| Display | 0 | 0 | 0 | 0 | 0 | 0 | 0 | 0 | 0 | 0 | 0 | 0 |
| Dependent young | 0 | 0 | 0 | 0 | 0 | 0 | 1 | 3 | 0 | 0 | 0 | 0 |
| Faecal sac | 0 | 0 | 0 | 0 | 0 | 0 | 0 | 0 | 0 | 0 | 0 | 0 |
| Inspecting hollow | 0 | 0 | 0 | 0 | 0 | 0 | 0 | 0 | 0 | 0 | 0 | 0 |
| Nest building | 0 | 0 | 0 | 0 | 0 | 0 | 0 | 0 | 0 | 0 | 0 | 0 |
| Nest with eggs | 0 | 0 | 0 | 0 | 0 | 0 | 0 | 0 | 0 | 0 | 0 | 0 |
| Nest with young | 0 | 0 | 0 | 0 | 0 | 0 | 0 | 0 | 0 | 0 | 0 | 0 |
| On/leaving nest | 0 | 0 | 0 | 0 | 0 | 0 | 1 | 0 | 0 | 0 | 0 | 0 |
| All years | ||||||||||||
| Breeding (BLA code) | 0 | 0 | 0 | 0 | 1 | 0 | 0 | 0 | 1 | 0 | 0 | 0 |
| Carrying Food | 0 | 0 | 0 | 0 | 0 | 0 | 0 | 1 | 0 | 1 | 0 | 0 |
| Copulating | 0 | 0 | 0 | 1 | 2 | 0 | 0 | 0 | 0 | 0 | 0 | 0 |
| Display | 0 | 0 | 0 | 0 | 0 | 0 | 0 | 0 | 0 | 0 | 0 | 0 |
| Dependent young | 0 | 0 | 0 | 6 | 3 | 3 | 15 | 14 | 0 | 1 | 0 | 0 |
| Faecal sac | 0 | 0 | 0 | 0 | 0 | 0 | 0 | 0 | 0 | 0 | 0 | 0 |
| Inspecting hollow | 0 | 0 | 0 | 0 | 0 | 0 | 0 | 0 | 0 | 0 | 0 | 0 |
| Nest building | 0 | 0 | 2 | 6 | 7 | 3 | 2 | 0 | 0 | 0 | 0 | 0 |
| Nest with eggs | 0 | 0 | 0 | 0 | 0 | 0 | 0 | 3 | 0 | 0 | 0 | 0 |
| Nest with young | 0 | 0 | 0 | 2 | 0 | 0 | 1 | 0 | 0 | 0 | 0 | 0 |
| On/leaving nest | 0 | 0 | 0 | 6 | 0 | 1 | 1 | 1 | 1 | 0 | 0 | 0 |
Breeding records by year
Average number of breeding records per period by breeding code| Period | Breeding (BLA code) | Carrying Food | Copulating | Display | Dependent young | Faecal sac | Inspecting hollow | Nest building | Nest with eggs | Nest with young | On/leaving nest |
|---|---|---|---|---|---|---|---|---|---|---|---|
| All years | |||||||||||
| All | 0.1 | 0.1 | 0.1 | 0.0 | 1.2 | 0.0 | 0.0 | 0.6 | 0.1 | 0.1 | 0.3 |
| Previous years | |||||||||||
| All previous years | 0.1 | 0.1 | 0.1 | 0.0 | 1.1 | 0.0 | 0.0 | 0.6 | 0.1 | 0.1 | 0.3 |
| Previous 30 years | 0.1 | 0.1 | 0.1 | 0.0 | 1.3 | 0.0 | 0.0 | 0.7 | 0.1 | 0.1 | 0.3 |
| Previous 20 years | 0.1 | 0.1 | 0.1 | 0.0 | 0.9 | 0.0 | 0.0 | 0.6 | 0.1 | 0.1 | 0.5 |
| 10 year groups | |||||||||||
| [2007,2017) | 0.1 | 0.1 | 0.1 | 0.0 | 0.9 | 0.0 | 0.0 | 0.6 | 0.0 | 0.1 | 0.7 |
| [1997,2007) | 0.1 | 0.1 | 0.2 | 0.0 | 0.9 | 0.0 | 0.0 | 0.5 | 0.2 | 0.2 | 0.2 |
| [1987,1997) | 0.0 | 0.0 | 0.0 | 0.0 | 2.0 | 0.0 | 0.0 | 0.9 | 0.1 | 0.0 | 0.0 |
| 5 year groups | |||||||||||
| [2012,2017) | 0.0 | 0.0 | 0.2 | 0.0 | 0.4 | 0.0 | 0.0 | 0.6 | 0.0 | 0.2 | 0.4 |
| [2007,2012) | 0.2 | 0.2 | 0.0 | 0.0 | 1.4 | 0.0 | 0.0 | 0.6 | 0.0 | 0.0 | 1.0 |
| [2002,2007) | 0.2 | 0.0 | 0.2 | 0.0 | 1.0 | 0.0 | 0.0 | 0.8 | 0.2 | 0.2 | 0.4 |
| [1997,2002) | 0.0 | 0.2 | 0.2 | 0.0 | 0.8 | 0.0 | 0.0 | 0.2 | 0.2 | 0.2 | 0.0 |
| [1992,1997) | 0.0 | 0.0 | 0.0 | 0.0 | 0.4 | 0.0 | 0.0 | 0.4 | 0.0 | 0.0 | 0.0 |
| [1987,1992) | 0.0 | 0.0 | 0.0 | 0.0 | 3.6 | 0.0 | 0.0 | 1.4 | 0.2 | 0.0 | 0.0 |
| Year | |||||||||||
| 2017 | 0.0 | 0.0 | 0.0 | 0.0 | 4.0 | 0.0 | 0.0 | 0.0 | 0.0 | 0.0 | 1.0 |
| 2016 | 0.0 | 0.0 | 1.0 | 0.0 | 1.0 | 0.0 | 0.0 | 1.0 | 0.0 | 1.0 | 0.0 |
| 2015 | 0.0 | 0.0 | 0.0 | 0.0 | 1.0 | 0.0 | 0.0 | 1.0 | 0.0 | 0.0 | 2.0 |
| 2014 | 0.0 | 0.0 | 0.0 | 0.0 | 0.0 | 0.0 | 0.0 | 0.0 | 0.0 | 0.0 | 0.0 |
| 2013 | 0.0 | 0.0 | 0.0 | 0.0 | 0.0 | 0.0 | 0.0 | 1.0 | 0.0 | 0.0 | 0.0 |
| 2012 | 0.0 | 0.0 | 0.0 | 0.0 | 0.0 | 0.0 | 0.0 | 0.0 | 0.0 | 0.0 | 0.0 |
| 2011 | 0.0 | 0.0 | 0.0 | 0.0 | 1.0 | 0.0 | 0.0 | 0.0 | 0.0 | 0.0 | 2.0 |
| 2010 | 1.0 | 0.0 | 0.0 | 0.0 | 0.0 | 0.0 | 0.0 | 0.0 | 0.0 | 0.0 | 0.0 |
| 2009 | 0.0 | 1.0 | 0.0 | 0.0 | 2.0 | 0.0 | 0.0 | 2.0 | 0.0 | 0.0 | 0.0 |
| 2008 | 0.0 | 0.0 | 0.0 | 0.0 | 4.0 | 0.0 | 0.0 | 1.0 | 0.0 | 0.0 | 3.0 |
| 2007 | 0.0 | 0.0 | 0.0 | 0.0 | 0.0 | 0.0 | 0.0 | 0.0 | 0.0 | 0.0 | 0.0 |
| 2006 | 1.0 | 0.0 | 0.0 | 0.0 | 1.0 | 0.0 | 0.0 | 0.0 | 0.0 | 1.0 | 0.0 |
| 2005 | 0.0 | 0.0 | 0.0 | 0.0 | 2.0 | 0.0 | 0.0 | 0.0 | 1.0 | 0.0 | 1.0 |
| 2004 | 0.0 | 0.0 | 0.0 | 0.0 | 2.0 | 0.0 | 0.0 | 1.0 | 0.0 | 0.0 | 1.0 |
| 2003 | 0.0 | 0.0 | 1.0 | 0.0 | 0.0 | 0.0 | 0.0 | 2.0 | 0.0 | 0.0 | 0.0 |
| 2002 | 0.0 | 0.0 | 0.0 | 0.0 | 0.0 | 0.0 | 0.0 | 1.0 | 0.0 | 0.0 | 0.0 |
| 2001 | 0.0 | 1.0 | 0.0 | 0.0 | 2.0 | 0.0 | 0.0 | 1.0 | 1.0 | 1.0 | 0.0 |
| 2000 | 0.0 | 0.0 | 1.0 | 0.0 | 1.0 | 0.0 | 0.0 | 0.0 | 0.0 | 0.0 | 0.0 |
| 1999 | 0.0 | 0.0 | 0.0 | 0.0 | 0.0 | 0.0 | 0.0 | 0.0 | 0.0 | 0.0 | 0.0 |
| 1998 | 0.0 | 0.0 | 0.0 | 0.0 | 0.0 | 0.0 | 0.0 | 0.0 | 0.0 | 0.0 | 0.0 |
| 1997 | 0.0 | 0.0 | 0.0 | 0.0 | 1.0 | 0.0 | 0.0 | 0.0 | 0.0 | 0.0 | 0.0 |
| 1996 | 0.0 | 0.0 | 0.0 | 0.0 | 0.0 | 0.0 | 0.0 | 0.0 | 0.0 | 0.0 | 0.0 |
| 1995 | 0.0 | 0.0 | 0.0 | 0.0 | 1.0 | 0.0 | 0.0 | 0.0 | 0.0 | 0.0 | 0.0 |
| 1994 | 0.0 | 0.0 | 0.0 | 0.0 | 0.0 | 0.0 | 0.0 | 0.0 | 0.0 | 0.0 | 0.0 |
| 1993 | 0.0 | 0.0 | 0.0 | 0.0 | 1.0 | 0.0 | 0.0 | 0.0 | 0.0 | 0.0 | 0.0 |
| 1992 | 0.0 | 0.0 | 0.0 | 0.0 | 0.0 | 0.0 | 0.0 | 2.0 | 0.0 | 0.0 | 0.0 |
| 1991 | 0.0 | 0.0 | 0.0 | 0.0 | 2.0 | 0.0 | 0.0 | 1.0 | 0.0 | 0.0 | 0.0 |
| 1990 | 0.0 | 0.0 | 0.0 | 0.0 | 5.0 | 0.0 | 0.0 | 1.0 | 0.0 | 0.0 | 0.0 |
| 1989 | 0.0 | 0.0 | 0.0 | 0.0 | 4.0 | 0.0 | 0.0 | 3.0 | 1.0 | 0.0 | 0.0 |
| 1988 | 0.0 | 0.0 | 0.0 | 0.0 | 4.0 | 0.0 | 0.0 | 1.0 | 0.0 | 0.0 | 0.0 |
| 1987 | 0.0 | 0.0 | 0.0 | 0.0 | 3.0 | 0.0 | 0.0 | 1.0 | 0.0 | 0.0 | 0.0 |
| 1986 | 0.0 | 0.0 | 0.0 | 0.0 | 0.0 | 0.0 | 0.0 | 0.0 | 0.0 | 0.0 | 0.0 |
| 1985 | 0.0 | 0.0 | 0.0 | 0.0 | 0.0 | 0.0 | 0.0 | 0.0 | 0.0 | 0.0 | 0.0 |
| 1984 | 0.0 | 0.0 | 0.0 | 0.0 | 0.0 | 0.0 | 0.0 | 0.0 | 0.0 | 0.0 | 0.0 |
| 1983 | 0.0 | 0.0 | 0.0 | 0.0 | 0.0 | 0.0 | 0.0 | 0.0 | 0.0 | 0.0 | 0.0 |
| 1982 | 0.0 | 0.0 | 0.0 | 0.0 | 0.0 | 0.0 | 0.0 | 0.0 | 0.0 | 0.0 | 0.0 |
Distribution map
Distribution - 2017
This map shows the observed distribution of the Fuscous Honeyeater for 2017.
The red circles are the grid cells where Fuscous Honeyeater have been reported.
The transparency of the red circles indicate how many surveys sheets were submitted for that grid cell; the darker the red the more reliable the data. Of the 315 grid cells with reports, 83 had only one sheet; an example is grid number A11.
The size of the circle represents the reporting rate. The maximum reporting rate for Fuscous Honeyeater was 100.0% (eg grid number A11) and the minimum was 0.2% (eg grid number K14). 
Distribution - all years
This map shows the observed distribution of the Fuscous Honeyeater for all years.
The red circles are the grid cells where Fuscous Honeyeater have been reported.
The transparency of the red circles indicate how many surveys sheets were submitted for that grid cell; the darker the red the more reliable the data. Of the 703 grid cells with reports, 55 had only one sheet; an example is grid number P30.
The size of the circle represents the reporting rate. The maximum reporting rate for Fuscous Honeyeater was 100.0% (eg grid number M27) and the minimum was 0.1% (eg grid number K15). 
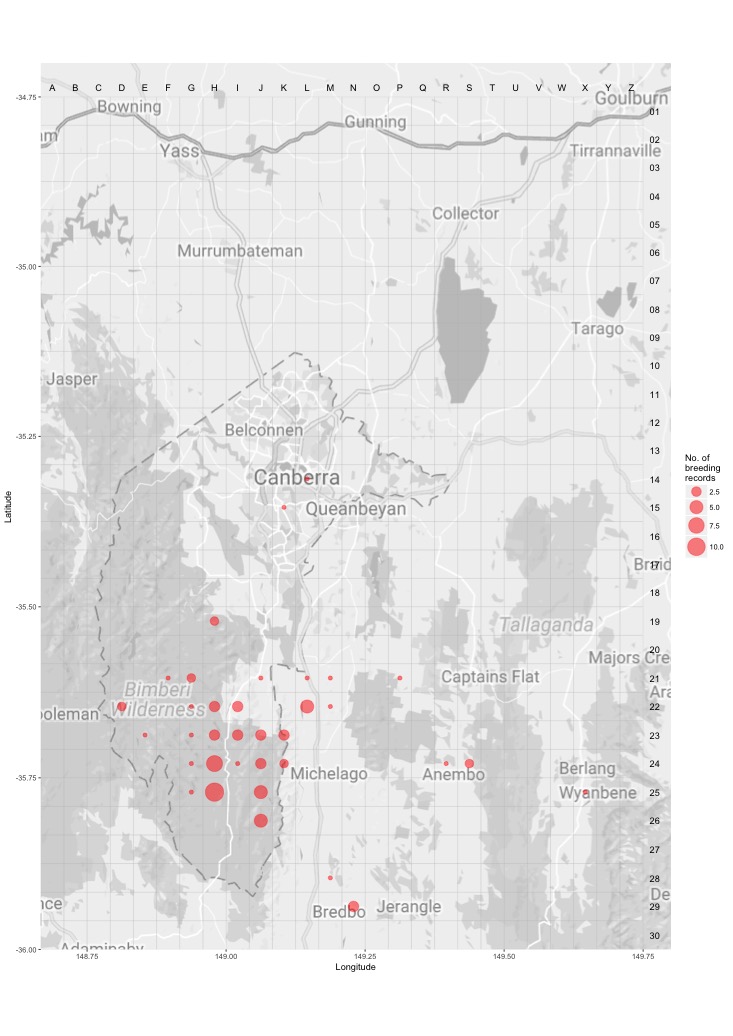
Breeding map
Breeding - 2017
This map shows the breeding distribution of the Fuscous Honeyeater for 2017.
The red circles are the grid cells where breeding activity for Fuscous Honeyeater have been reported.
The size of the circle represents the number of reports. 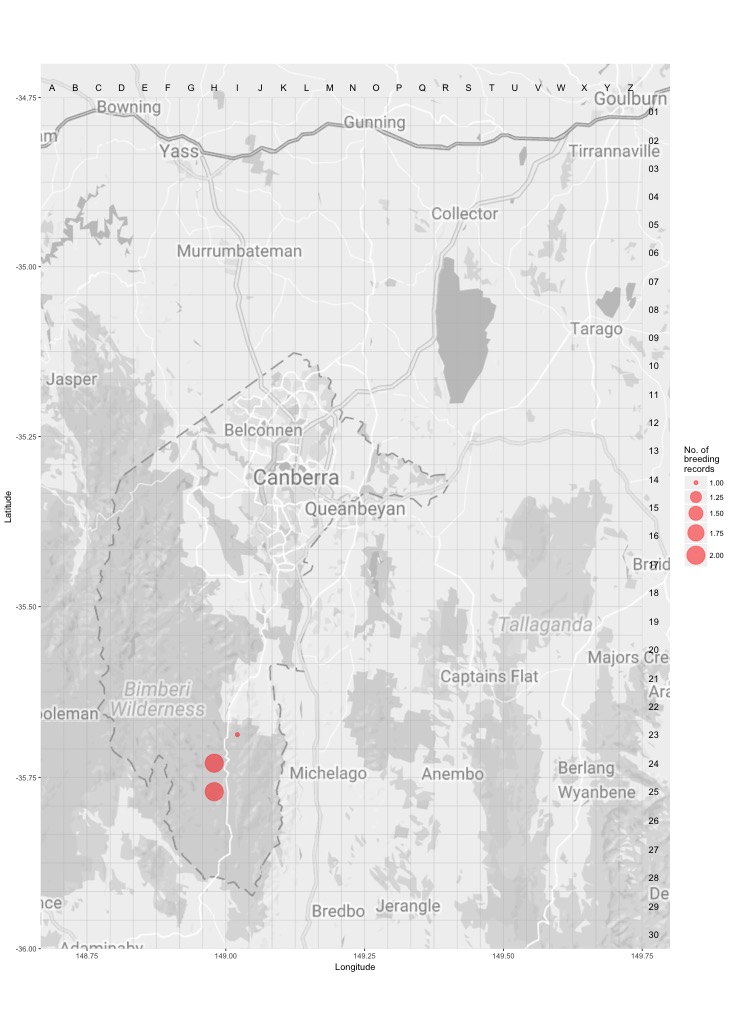
Breeding - all years
This map shows the breeding distribution of the Fuscous Honeyeater for all years.
The red circles are the grid cells where breeding activity for Fuscous Honeyeater have been reported.
The size of the circle represents the number of reports.